
Lumens & Latitudes: mapping Stellar events and funding over time
Lumens & Latitudes, the first Lumen Loop Labs experiment, is a world map of Stellar Community Fund funding and ecosystem events by country over time.
Lumens & Latitudes is the first experiment in Lumen Loop Labs, our space for small tools built on the ecosystem data we already collect. It is a world map of Stellar Community Fund funding and ecosystem events, by country, over time. Live at https://labs.lumenloop.com/latitudes
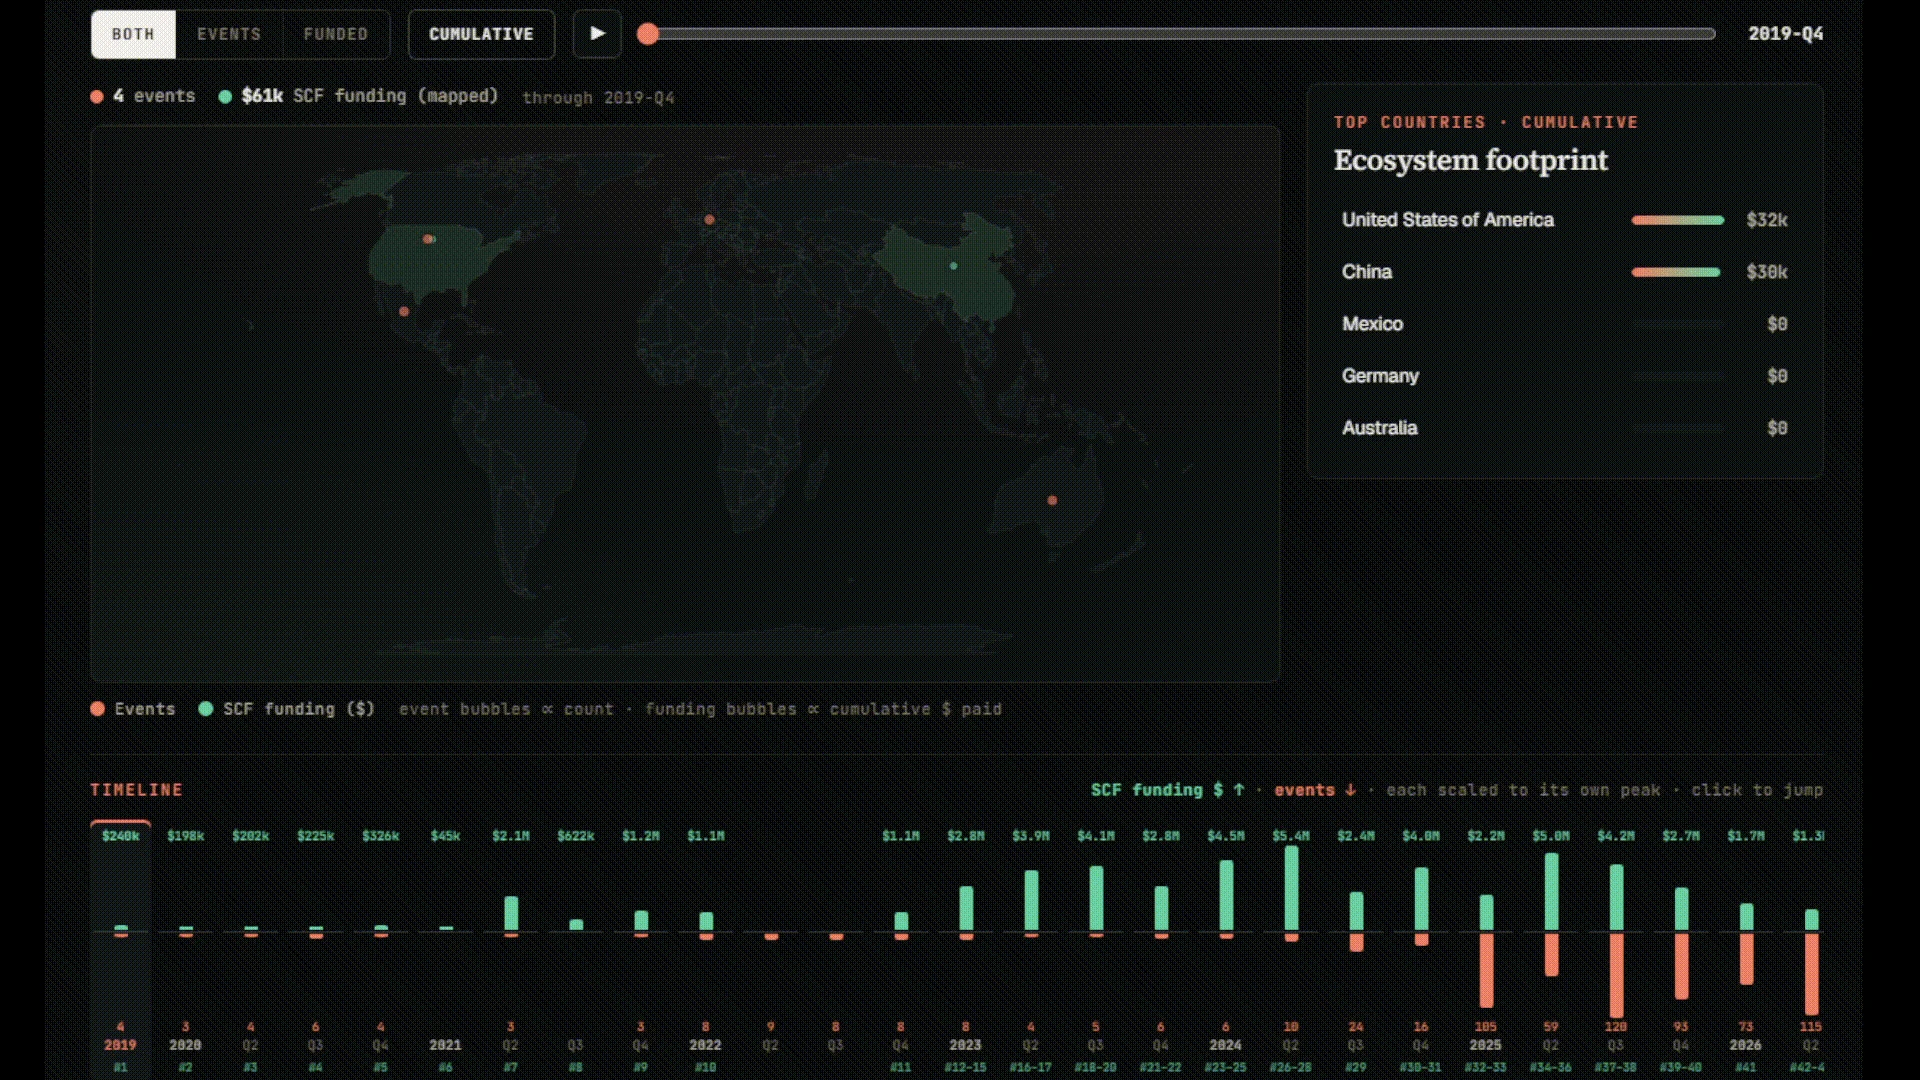
The map puts two things we track into one view. Countries are shaded and sized by SCF dollars and by event activity, and a timeline plays the data forward from the early funding rounds to today.
You can scrub through time to watch where funding and events spread, toggle between the funding and events layers or show both at once, zoom and pan into a busy region, and click any country to jump to its projects and events on the main site.
The value is perspective. Funding tables and event calendars are easy to read one row at a time and hard to read as a whole. On a map, the shape of the ecosystem shows up: which regions are active, where Stellar is putting money, and how both have moved over the years. It is a different way into the same data, and a starting point for questions a list does not surface.
More experiments will follow.
